
Programmatic Digital Out of Home (pDOOH) is a fast-growing media channel that uses automated technology for media buying to serve ads to the right user at the right time, and at the right price. It has the potential to be hugely effective for many small to medium businesses as well as agencies.
Two key metrics that are used to measure the effectiveness of pDOOH campaigns are Gross Rating Points (GRPs) and Target Rating Points (TRPs). It is important to understand how GRPs and TRPs function in pDOOH, including what they are, how they are calculated, and how they can be used to measure campaign effectiveness.
Gross Rating Points are a measure of the reach and frequency of an advertising campaign. They are calculated by multiplying the percentage of the target audience that is reached by the number of times that audience is exposed to the ad.
For example, if an ad reaches 50% of its target audience and is shown 10 times, the GRP for that ad would be 500. The higher the Gross Rating Points, the greater the reach and frequency of the campaign.
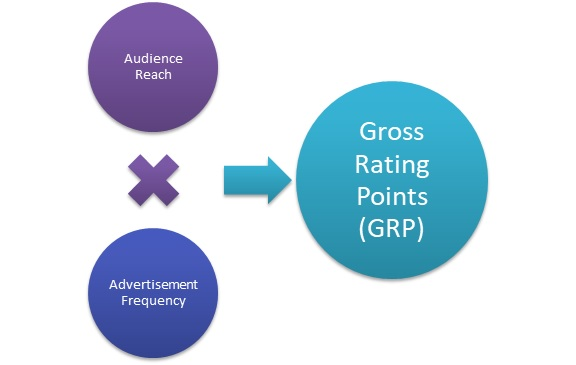
(Image source: mbaskool.com)
TRPs, on the other hand, are a measure of the effectiveness of an advertising campaign in reaching its target audience. They are calculated by multiplying the Gross Rating Points by the percentage of the target audience that is reached.
For example, if an ad has a GRP of 500 and reaches 50% of its target audience, the TRP for that ad would be 250. The higher the TRP, the more effective the campaign is in reaching its target audience.
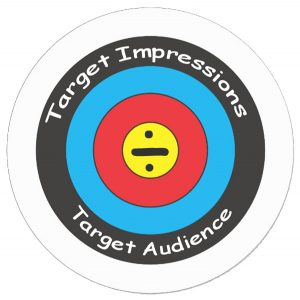
(Image source: marketing-dictionary.org)
When it comes to DOOH advertising, GRPs and TRPs can be calculated using a variety of metrics, including audience data, impression data anddwell time data.
Examples of GRP and TRP Figures
GRP and TRP figures can vary greatly across different industries and campaigns as well as location. A campaign on a digital billboard located on a busy highway could have a GRP of 300-500, whilst one on a digital kiosk located in a shopping mall, could be around 150-300.
The TRP for the former might be around 200-400 and for the latter, that targets a specific audience, might be around 100-200.
Let’s look at two examples of how both these metrics come into play in two different industries, restaurants and fashion:
A Fast Food Chain:

(Image source: uniledsolutions.com)
A fast-food chain wants to launch a new sandwich and wants to target young adults aged 18-35. They decide to place their ads on digital billboards located near college campuses and in high-traffic areas around the city.
By using audience data, they are able to determine that their ads reach 60% of their target audience, and are shown an average of 15 times per day. They calculate the GRP for their campaign to be 900 (60% x 15).
They also use TRP to determine the effectiveness of the campaign in reaching their target audience, which is 540 (900 x 60%).
They compare these numbers to industry benchmarks and previous campaigns, and decide to increase the frequency of the ad to reach a higher TRP. They also decide to target specific times of the day when their target audience is more likely to be near the billboards, like lunch and dinner times, to reach more of the target audience effectively.
Based on the TRP and GRP data, they also decide to allocate more budget for a social media campaign targeting the same audience and use the same creative to reach more of the target audience.
A Clothing Boutique:

(Image source: pickcel.com)
A small clothing boutique wants to launch a new line of clothing and wants to target fashion-conscious women aged 25-45.
They decide to place their ads on digital billboards located on busy streets in the city center.
Check this out to learn how to get your SMB noticed
Using audience data, they are able to determine that their ads reach 35% of their target audience and are shown an average of 10 times per day.
They calculate the GRP for their campaign to be 350 (35% x 10). They also use TRP to determine the effectiveness of the campaign in reaching their target audience, which is 122.5 (350 x 35%).
They compare these numbers to industry benchmarks and previous campaigns, and decide to increase the frequency of the ad to reach a higher TRP. They also decide to target specific neighborhoods with a higher concentration of their target audience, to reach more of the target audience effectively.
Based on the TRP and GRP data, they also decide to allocate more budget for a social media campaign targeting the same audience and use the same creative to reach more of the target audience.
These examples illustrate how TRPs and GRPs can be used to measure the effectiveness of DOOH campaigns and make informed decisions about media planning and buying. By understanding the reach and frequency of a campaign and its ability to reach its target audience, you can optimize your campaigns and improve your ROI.
Get Started with Programmatic DOOH Today
Measuring a pDOOH campaign is important because it allows you to determine the effectiveness of your advertising efforts and make data-driven decisions for future campaigns.
With The Neuron, you can launch your next campaign in minutes and see it live on premium DOOH ad inventory the same day.
Start now!

Read more about Programmatic Digital Out of Home
What Is Programmatic Digital Out of Home Advertising?
Build the Perfect Campaign with DOOH Programmatic Advertising
3 Best Ways to Use programmatic DOOH to Engage Customers
Digital Out-of-Home Programmatic: Best Practices for Success